Taking Basemaps to the next generation
Dave George | 21 April 2022


Web mapping has evolved since the first geospatial mapping servers were built over 30 years ago. Through the evolution of the internet, UX requires intuitive, instant maps on desktop and mobile devices, driven by the success of platforms such as Google Maps and Bing Maps from a consumer-based level this expectation has been set
Today users access geospatial information on devices that do not have the storage capacity for high-resolution maps for example datasets such as Ordnance Survey MasterMap. Instead, apps and websites show geospatial data that is served as required over the web.
When a web map is loaded, it is set to a zoom level and extent, this defines the level of detail and the area that will be visible to the viewer. The server sends tiles which are essentially grid sections of the map to the user, where they are arranged in the right configuration to appear as a map. As the user navigates the map, requests for the correct tiles are sent, and the response is used to update the screen accordingly.
Vector vs Raster
Geospatial Data comes in two distinct formats:
- Raster data represents data in grids of regular-sized pixels which are rendered on a map, or of which are the same size. By assigning each pixel in the grid value images can be described with numbers. This is useful because it means images can be represented, processed, and stored by computers as binary digits.
Traditionally services adhering to open-source standards such as a WMS or WMTS serve raster tile images to a client, where they are processed and displayed on the screen for the user. All raster data is pre-rendered thus the end client has no control over the rendering
- With vector data, rather than representing space in a regular grid, entire geographic features are represented as geometric locations (x, y values). Points are stored as coordinate pairs; lines as arrays (or sequences) of coordinate pairs; and polygons as sequences of coordinate pairs that end where they start. For lines and polygons, each coordinate pair represents a corner, of features such as curbs, road centrelines, or buildings at a range of resolutions.
Different types of features are organised in layers. For example, a layer of polylines might represent gas mains, while another might represent hydrants.
Vector Tiles in more context
Vector Tiles combine the benefits of vector data which is structured as a tiled raster, comprising of clipped tiles, or grid squares, with layers of vector features. Like with raster tiles they are served in a similar fashion; a client application requests tiles based on a zoom level and extent, and the server responds with data representing the vector tiles containing the layers to be visualised on that map.
Rendering is done by the client. As desktop and mobile devices have become more powerful, vector tiles are an increasingly effective way to create interactive web maps.
But why is this the case?
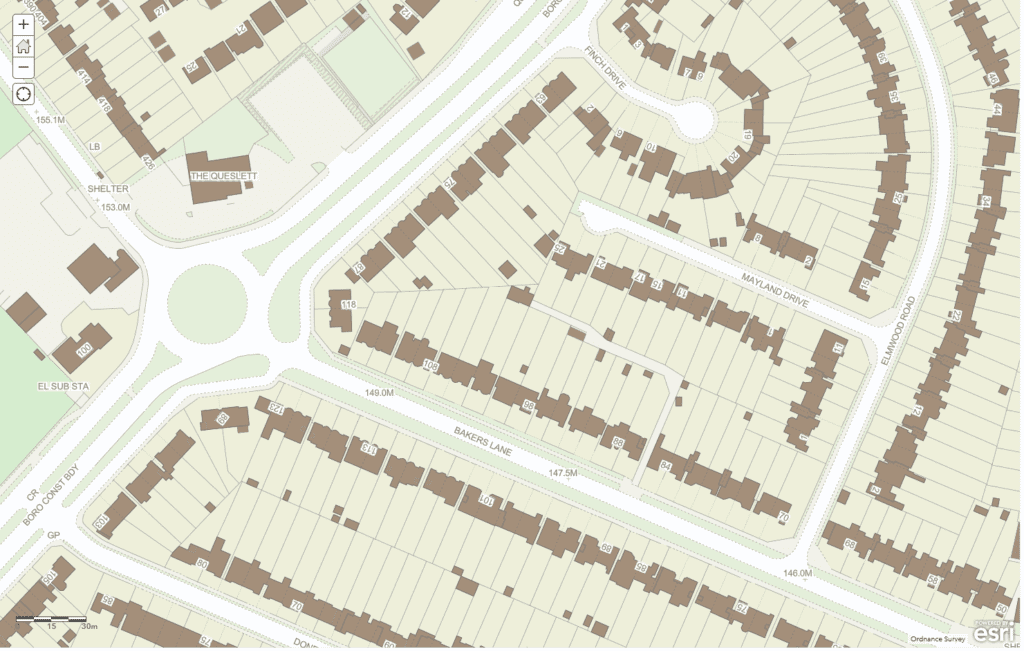
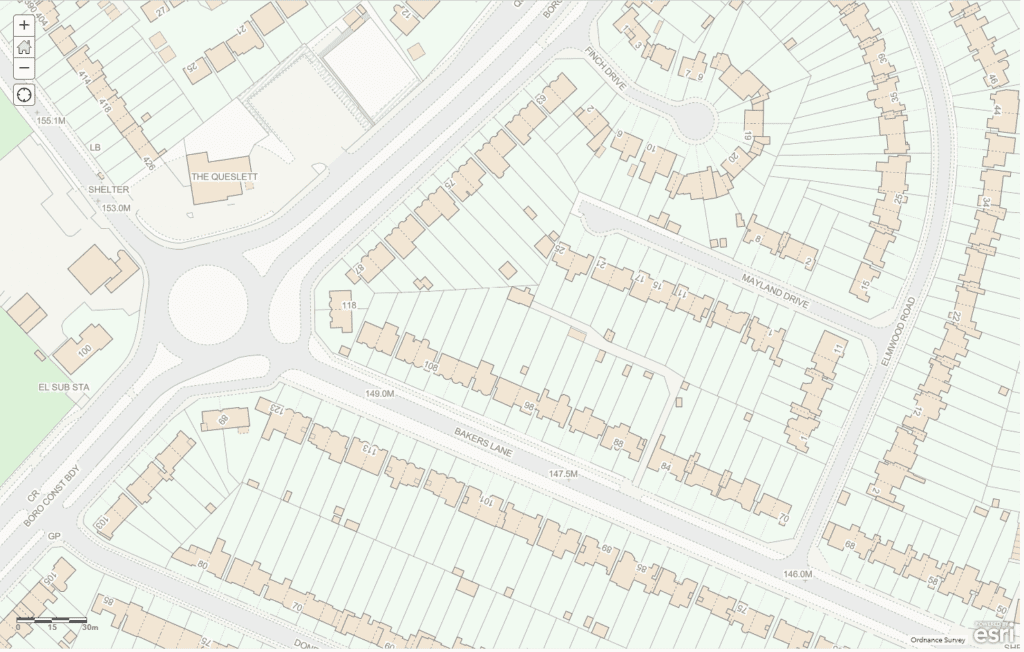
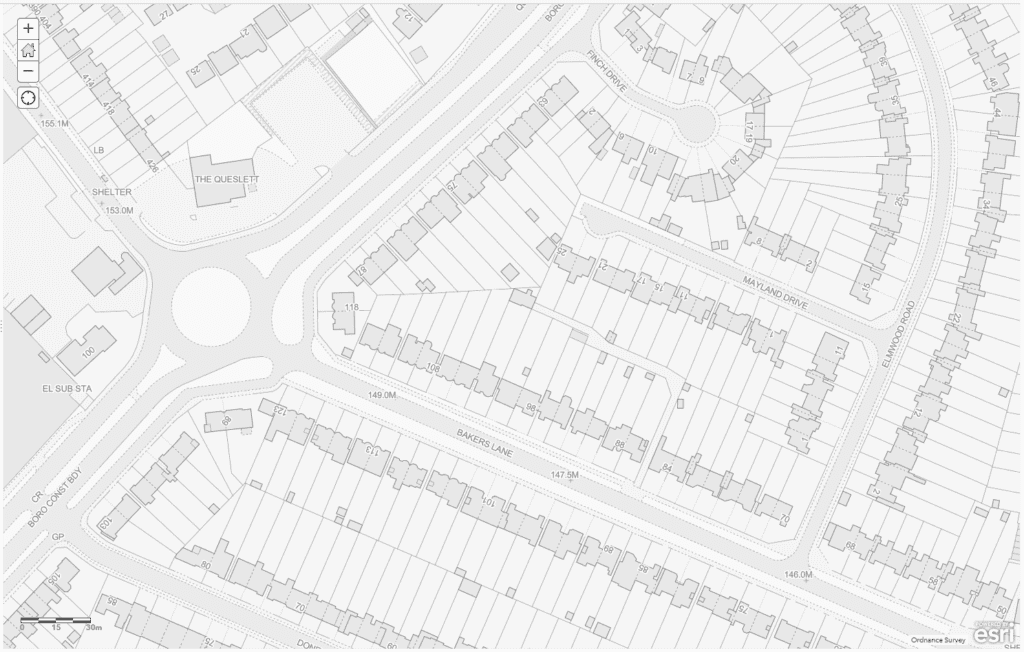
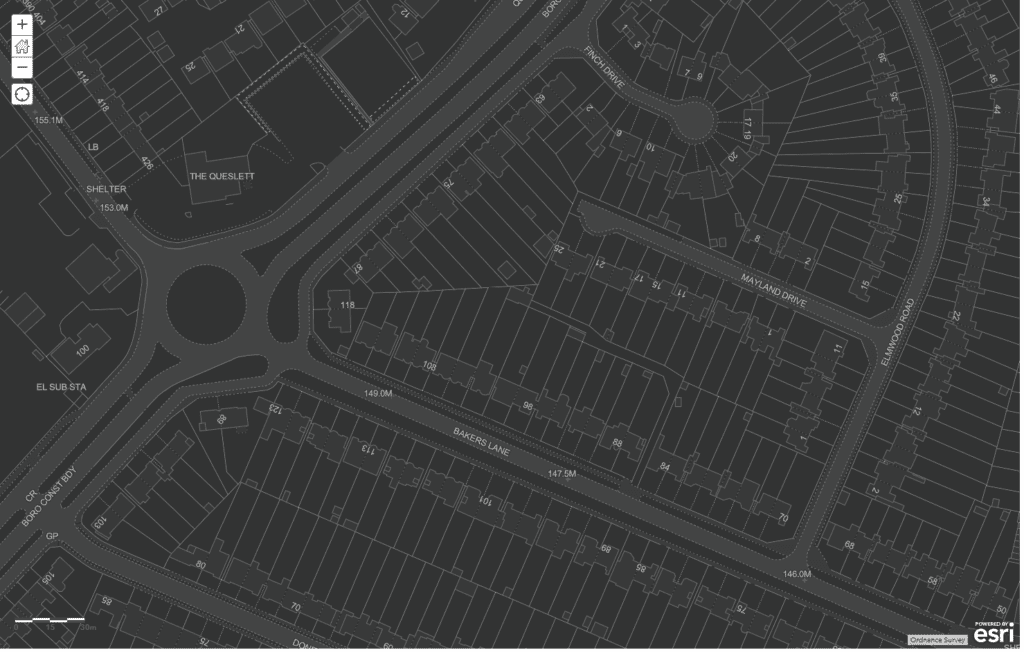
The power of Vector Tiles, by utilising separate stylesheets, styling can be easily configured to suit the mapping needs from the same data source without the additional storage and processing with traditional raster tiles. In these examples, Ordnance Survey Master is styled with a standard Cartographic style, Backdrop Style, Greyscale and Dark Greyscales styles all from the same cached data source.
The benefits
Vector tiles offer several advantages over raster map tiles for web mapping:
- The styling can be customised comprehensively by the user. For example, the map can be rendered for nighttime use so that display is more comfortable on the user’s eye when working with a mobile device at night. Because they are rendered in the client application, custom styles can be defined and applied when the map is created. Designers can adapt the style of their maps so they match organisational colour schemes or end-user requirements. Comparing this with traditional raster WMTS tiles, for each style or render, a complete set of tiles has to be produced for render which in turn results in additional processing time and storage costs all for the same dataset but for different styles.
- Maps made with vector tiles are fast. A vector tile service sends less data than a raster service would send for the same map, meaning lower bandwidth use and lower disk space requirements. Features are optimised and styles are only defined once before being applied to a layer no matter how many features. This makes vector tile maps great for mobile use where all too often poor cellular coverage can cause low bandwidth in certain locations.
- Vector Tile maps have a much smoother zooming effect than raster maps. Because raster data is represented as pixels, maps can get pixelated as a user zoom in, until a higher-resolution tile is received from the server. Vector tiles instead maintain smooth zooming and scaling effect with the use of a Vector Tile index which builds more tiles in areas with more vector data such as in urban areas and fewer tiles with fewer data such as in coastal and rural areas.
Vector features are often served with attribution. This means that the individual features include some additional information. Many vector tile services include some attribute data to make sure maps load quickly and, even with minimal attribution, map developers can apply styles and interactivity to vector features that are not possible with raster maps.
Within web development and GIS solutions, vector tile maps are now well supported and can be developed with common mapping libraries including:
- OpenLayers
- Leaflet JS
- Mapbox
- ArcGIS API for JavaScript
and in GIS platforms such as:
- ArcGIS Online,
- ArcGIS Pro
- QGIS.
With all these advantages, vector tile maps are a must-know for any GIS professional. MGISS Professional Services team provides a wide range of Consultancy Services with VectorTile Maps which include:
- Migrating from traditional RasterTiles to VectorTiles,
- Designing and building VectorTile Packages for use in ArcGIS Online and GeoServer,
- Producing stylesheets to business needs along
- Producing Vector Tiles to customers with custom cookie-cut datasets
To find out more, why not send our Professional Services team a consultancy enquiry by completing your details here.
About
With a background in COTS and Opensource development and database design, Dave has over 15 years of industry experience with utility and infrastructure asset owners. Dave’s expertise covers asset infrastructure development and geospatial technology provision, enabling seamless data management and achieving massive efficiency and cost savings with enterprise organisations.


